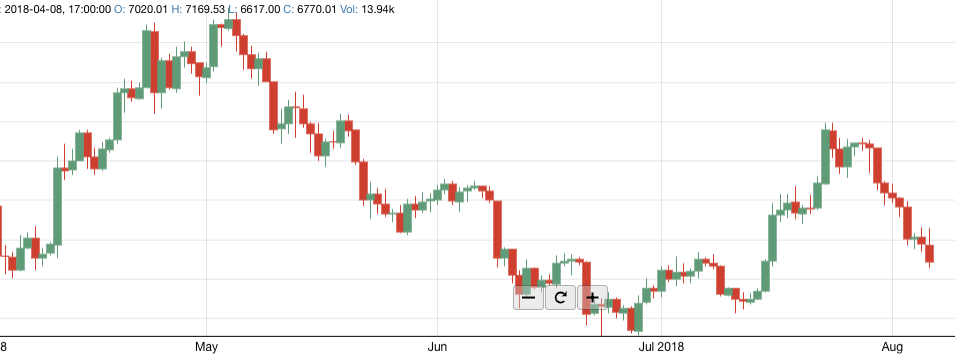
Представим, что вам поставили задачу создать график, аналогичный представленному на платформе tradingview.com. Такие графики используются для отображения информации, например, в торговых платформах. Решение задачи с нуля будет достаточно сложным, поэтому сначала стоит проанализировать уже имеющиеся наработки.
Если провести поиск готовых решений в Интернете, выяснится, что графических библиотек на React множество. Но единственный, уникальный в своем роде проект, позволяющий с минимальными временными затратами решить поставленную задачу, – проект React Stockcharts. Эта библиотека написана на React и уже включает в себя поддержку некоторых индикаторов и элементов рисования, а также динамическую загрузку данных с отрисовкой баров. Другие графические библиотеки не имеют данного функционала и требуют значительной доработки. Нам же остается только расширить React Stockcharts добавлением новых индикаторов и элементов рисования. Цель этой статьи – показать, как расширить функционал библиотеки и добавить новые элементы.
React Stockcharts использует d3js, поддерживает рисование на canvas и SVG, элементы библиотеки структурированы и разделены на отдельные компоненты. Это облегчает понимание логики работы библиотеки. При разработке использовалась версия React 16.8.6, для сборки проекта используется babel и webpack.
С чего начать?
Первое, что нужно сделать, – скачать исходный код библиотеки с github. Проинсталлируйте зависимости, выполнив npm install —save react-stockcharts, и запустите проект командой npm run watch.
Структура папок подсказывает, как организован проект. Все элементы графика разделены на отдельные компоненты и называются соответственно.

Создание нового индикатора
Добавление индикатора рассмотрим на примере Money Flow Index. Для создания нового индикатора нужно выполнить следующие действия:
1. Создать файл mfi.js в папке indicator. В нем осуществляется привязка алгоритма, способа рисования и других свойств к индикатору.
import { rebind, merge } from "../utils"; import { mfi } from "../calculator"; import baseIndicator from "./baseIndicator"; const ALGORITHM_TYPE = "MFI"; export default function() { const base = baseIndicator() .type(ALGORITHM_TYPE) .accessor(d => d.mfi); const underlyingAlgorithm = mfi(); const mergedAlgorithm = merge() .algorithm(underlyingAlgorithm) .merge((datum, indicator) => { datum.mfi = indicator; }); const indicator = function(data, options = { merge: true }) { if (options.merge) { if (!base.accessor()) throw new Error(`Set an accessor to ${ALGORITHM_TYPE} before calculating`); return mergedAlgorithm(data); } return underlyingAlgorithm(data); }; rebind(indicator, base, "id", "accessor", "stroke", "fill", "echo", "type"); rebind(indicator, underlyingAlgorithm, "undefinedLength"); rebind(indicator, underlyingAlgorithm, "options"); rebind(indicator, mergedAlgorithm, "merge", "skipUndefined"); return indicator; }
2. Создать файл mfi.js в папке calculator. Здесь реализован математический алгоритм для индикатора.
import { mean } from "d3-array"; import { slidingWindow } from "../utils"; import { MFI as defaultOptions } from "./defaultOptionsForComputation"; export default function() { let options = defaultOptions; function calculator(data) { const { windowSize } = options; let typical_price, typical_price_privious, money_flow, flow_ratio, flow_index, val_positive_minus, val_negative_minus, money_flow_privious; let val_positive = 0, val_negative = 0, ind = 0; const arr_positive = [], arr_negative = []; return data.map(function(d,i){ if(i === 0){ typical_price_privious = (d.high + d.low + d.close) / 3; ind++; } else { typical_price = (d.high + d.low + d.close) / 3; money_flow = typical_price * d.volume; if(typical_price >= typical_price_privious){ val_positive += money_flow; arr_positive.push(money_flow); arr_negative.push(0); } else { val_negative += money_flow; arr_negative.push(money_flow); arr_positive.push(0); } if(ind >= windowSize ){ if(i !== windowSize){ val_positive = val_positive - val_positive_minus; val_negative = val_negative - val_negative_minus; } val_positive_minus = arr_positive[0]; val_negative_minus = arr_negative[0]; arr_positive.shift(); arr_negative.shift(); } typical_price_privious = typical_price; money_flow_privious = money_flow; if(ind >= windowSize){ flow_ratio = val_positive / val_negative; flow_index = 100 - (100 / (1 + flow_ratio)); ind++; return flow_index; } else { ind++; return undefined; } } }); } calculator.undefinedLength = function() { const { windowSize } = options; return windowSize - 1; }; calculator.options = function(x) { if (!arguments.length) { return options; } options = { ...defaultOptions, ...x }; return calculator; }; return calculator; }
3. Файл calculator/defaultOptionsForComputation.js содержит значение параметров по умолчанию, для вычислений и для рисования графика.
... export const MFI = { source: d => ({volume: d.volume, high: d.high, low: d.low}), // "high", "low", "open", "close" sourcePath: "volume/high/low", windowSize: 10, }; ...
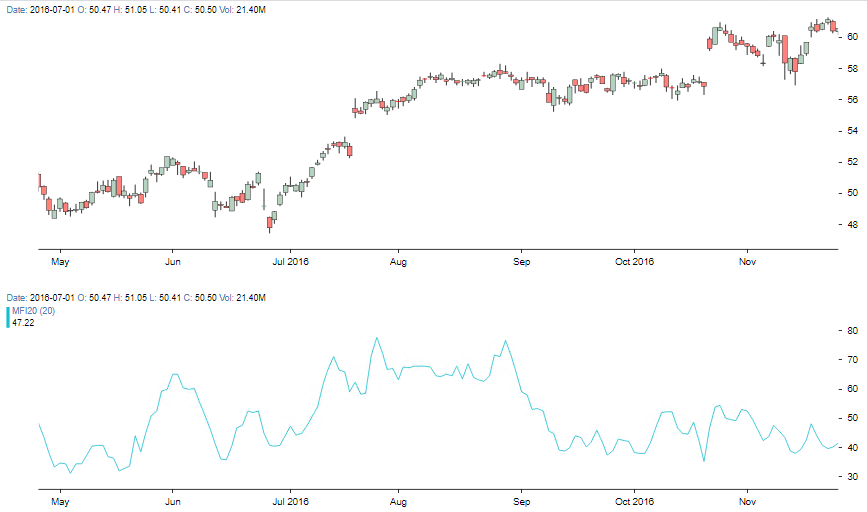
Для данного индикатора используется стандартный tooltip из tooltip/MovingAverageTooltip.js. Для рисования линии индикатора используется компонент LineSeries из series/LineSeries.js. Более сложные индикаторы состоят из комбинации отдельных элементов LineSeries, CircleMarker и т.д.
Результат работы индикатора MFI представлен на рисунке:
Добавления элемента рисования.
В примере ниже в библиотеку добавляется элемент рисования – прямоугольник.
1. Создадим файл RectangleSimple.js в папке interactive/components. В данном файле реализован алгоритм рисования прямоугольника, определяется, когда курсор мыши находится над элементом, свойство isHovering.
import React, { Component } from "react"; import PropTypes from "prop-types"; import GenericChartComponent from "../../GenericChartComponent"; import { getMouseCanvas } from "../../GenericComponent"; import { isDefined, noop, hexToRGBA, getStrokeDasharray, strokeDashTypes, } from "../../utils"; class RectangleSimple extends Component { constructor(props) { super(props); this.renderSVG = this.renderSVG.bind(this); this.drawOnCanvas = this.drawOnCanvas.bind(this); this.isHover = this.isHover.bind(this); } isHover(moreProps) { const { tolerance, onHover } = this.props; if (isDefined(onHover)) { const { x1Value, x2Value, y1Value, y2Value, type } = this.props; const { mouseXY, xScale } = moreProps; const { chartConfig: { yScale } } = moreProps; const hovering = isHovering({ x1Value, y1Value, x2Value, y2Value, mouseXY, type, tolerance, xScale, yScale, }); // console.log("hovering ->", hovering); return hovering; } return false; } drawOnCanvas(ctx, moreProps) { const { stroke, strokeWidth, strokeOpacity, strokeDasharray, type, fill, fillOpacity, isFill } = this.props; const { x1, y1, x2, y2 } = helper(this.props, moreProps); const width = x2 - x1; const height = y2 - y1; ctx.beginPath(); ctx.rect(x1, y1, width, height); ctx.stroke(); if(isFill){ ctx.fillStyle = hexToRGBA(fill, fillOpacity); ctx.fill(); } } renderSVG(moreProps) { const { stroke, strokeWidth, strokeOpacity, strokeDasharray } = this.props; const lineWidth = strokeWidth; const { x1, y1, x2, y2 } = helper(this.props, moreProps); return ( ); } render() { const { selected, interactiveCursorClass } = this.props; const { onDragStart, onDrag, onDragComplete, onHover, onUnHover } = this.props; return ; } } export function isHovering2(start, end, [mouseX, mouseY], tolerance) { const m = getSlope(start, end); if (isDefined(m)) { const b = getYIntercept(m, end); const y = m * mouseX + b; return (mouseY < y + tolerance) && mouseY > (y - tolerance) && mouseX > Math.min(start[0], end[0]) - tolerance && mouseX < Math.max(start[0], end[0]) + tolerance; } else { return mouseY >= Math.min(start[1], end[1]) && mouseY <= Math.max(start[1], end[1]) && mouseX < start[0] + tolerance && mouseX > start[0] - tolerance; } } export function isHovering({ x1Value, y1Value, x2Value, y2Value, mouseXY, type, tolerance, xScale, yScale, }) { const line = generateLine({ type, start: [x1Value, y1Value], end: [x2Value, y2Value], xScale, yScale, }); const start = [xScale(line.x1), yScale(line.y1)]; const end = [xScale(line.x2), yScale(line.y2)]; const m = getSlope(start, end); const [mouseX, mouseY] = mouseXY; if (isDefined(m)) { const b = getYIntercept(m, end); const y = m * mouseX + b; return mouseY < (y + tolerance) && mouseY > (y - tolerance) && mouseX > Math.min(start[0], end[0]) - tolerance && mouseX < Math.max(start[0], end[0]) + tolerance; } else { return mouseY >= Math.min(start[1], end[1]) && mouseY <= Math.max(start[1], end[1]) && mouseX < start[0] + tolerance && mouseX > start[0] - tolerance; } } function helper(props, moreProps) { const { x1Value, x2Value, y1Value, y2Value, type } = props; const { xScale, chartConfig: { yScale } } = moreProps; const modLine = generateLine({ type, start: [x1Value, y1Value], end: [x2Value, y2Value], xScale, yScale, }); const x1 = xScale(modLine.x1); const y1 = yScale(modLine.y1); const x2 = xScale(modLine.x2); const y2 = yScale(modLine.y2); return { x1, y1, x2, y2 }; } export function getSlope(start, end) { const m /* slope */ = end[0] === start[0] ? undefined : (end[1] - start[1]) / (end[0] - start[0]); return m; } export function getYIntercept(m, end) { const b /* y intercept */ = -1 * m * end[0] + end[1]; return b; } export function generateLine({ type, start, end, xScale, yScale }) { const m /* slope */ = getSlope(start, end); // console.log(end[0] - start[0], m) const b /* y intercept */ = getYIntercept(m, start); switch (type) { case "XLINE": return getXLineCoordinates({ type, start, end, xScale, yScale, m, b }); case "RAY": return getRayCoordinates({ type, start, end, xScale, yScale, m, b }); case "LINE": return getLineCoordinates({ type, start, end, xScale, yScale, m, b }); } } function getXLineCoordinates({ start, end, xScale, yScale, m, b }) { const [xBegin, xFinish] = xScale.domain(); const [yBegin, yFinish] = yScale.domain(); if (end[0] === start[0]) { return { x1: end[0], y1: yBegin, x2: end[0], y2: yFinish, }; } const [x1, x2] = end[0] > start[0] ? [xBegin, xFinish] : [xFinish, xBegin]; return { x1, y1: m * x1 + b, x2, y2: m * x2 + b }; } function getRayCoordinates({ start, end, xScale, yScale, m, b }) { const [xBegin, xFinish] = xScale.domain(); const [yBegin, yFinish] = yScale.domain(); const x1 = start[0]; if (end[0] === start[0]) { return { x1, y1: start[1], x2: x1, y2: end[1] > start[1] ? yFinish : yBegin, }; } const x2 = end[0] > start[0] ? xFinish : xBegin; return { x1, y1: m * x1 + b, x2, y2: m * x2 + b }; } function getLineCoordinates({ start, end }) { const [x1, y1] = start; const [x2, y2] = end; if (end[0] === start[0]) { return { x1, y1: start[1], x2: x1, y2: end[1], }; } return { x1, y1, x2, y2, }; } RectangleSimple.propTypes = { x1Value: PropTypes.any.isRequired, x2Value: PropTypes.any.isRequired, y1Value: PropTypes.any.isRequired, y2Value: PropTypes.any.isRequired, interactiveCursorClass: PropTypes.string, stroke: PropTypes.string.isRequired, strokeWidth: PropTypes.number.isRequired, strokeOpacity: PropTypes.number.isRequired, strokeDasharray: PropTypes.oneOf(strokeDashTypes), type: PropTypes.oneOf([ "XLINE", // extends from -Infinity to +Infinity "RAY", // extends to +/-Infinity in one direction "LINE", // extends between the set bounds ]).isRequired, onEdge1Drag: PropTypes.func.isRequired, onEdge2Drag: PropTypes.func.isRequired, onDragStart: PropTypes.func.isRequired, onDrag: PropTypes.func.isRequired, onDragComplete: PropTypes.func.isRequired, onHover: PropTypes.func, onUnHover: PropTypes.func, defaultClassName: PropTypes.string, r: PropTypes.number.isRequired, edgeFill: PropTypes.string.isRequired, edgeStroke: PropTypes.string.isRequired, edgeStrokeWidth: PropTypes.number.isRequired, withEdge: PropTypes.bool.isRequired, children: PropTypes.func.isRequired, tolerance: PropTypes.number.isRequired, selected: PropTypes.bool.isRequired, }; RectangleSimple.defaultProps = { onEdge1Drag: noop, onEdge2Drag: noop, onDragStart: noop, onDrag: noop, onDragComplete: noop, edgeStrokeWidth: 3, edgeStroke: "#000000", edgeFill: "#FFFFFF", r: 10, withEdge: false, strokeWidth: 1, strokeDasharray: "Solid", children: noop, tolerance: 7, selected: false, }; export default RectangleSimple;
2. Создадим файл EachRectangle.js в папке interactive/wrapper. Здесь определяются правила рисования множества прямоугольников.
import React, { Component } from "react"; import PropTypes from "prop-types"; import { ascending as d3Ascending } from "d3-array"; import { noop, strokeDashTypes } from "../../utils"; import { saveNodeType, isHover } from "../utils"; import { getXValue } from "../../utils/ChartDataUtil"; import Rectangle from "../components/Rectangle"; import ClickableCircle from "../components/ClickableCircle"; import HoverTextNearMouse from "../components/HoverTextNearMouse"; class EachRectangle extends Component { constructor(props) { super(props); this.handleEdge1Drag = this.handleEdge1Drag.bind(this); this.handleEdge2Drag = this.handleEdge2Drag.bind(this); this.handleLineDragStart = this.handleLineDragStart.bind(this); this.handleLineDrag = this.handleLineDrag.bind(this); this.handleEdge1DragStart = this.handleEdge1DragStart.bind(this); this.handleEdge2DragStart = this.handleEdge2DragStart.bind(this); this.handleDragComplete = this.handleDragComplete.bind(this); this.handleHover = this.handleHover.bind(this); this.isHover = isHover.bind(this); this.saveNodeType = saveNodeType.bind(this); this.nodes = {}; this.state = { hover: false, }; } handleLineDragStart() { const { x1Value, y1Value, x2Value, y2Value, } = this.props; this.dragStart = { x1Value, y1Value, x2Value, y2Value, }; } handleLineDrag(moreProps) { const { index, onDrag } = this.props; const { x1Value, y1Value, x2Value, y2Value, } = this.dragStart; const { xScale, chartConfig: { yScale }, xAccessor, fullData } = moreProps; const { startPos, mouseXY } = moreProps; const x1 = xScale(x1Value); const y1 = yScale(y1Value); const x2 = xScale(x2Value); const y2 = yScale(y2Value); const dx = startPos[0] - mouseXY[0]; const dy = startPos[1] - mouseXY[1]; const newX1Value = getXValue(xScale, xAccessor, [x1 - dx, y1 - dy], fullData); const newY1Value = yScale.invert(y1 - dy); const newX2Value = getXValue(xScale, xAccessor, [x2 - dx, y2 - dy], fullData); const newY2Value = yScale.invert(y2 - dy); onDrag(index, { x1Value: newX1Value, y1Value: newY1Value, x2Value: newX2Value, y2Value: newY2Value, }); } handleEdge1DragStart() { this.setState({ anchor: "edge2" }); } handleEdge2DragStart() { this.setState({ anchor: "edge1" }); } handleDragComplete(...rest) { this.setState({ anchor: undefined }); this.props.onDragComplete(...rest); } handleEdge1Drag(moreProps) { const { index, onDrag } = this.props; const { x2Value, y2Value, } = this.props; const [x1Value, y1Value] = getNewXY(moreProps); onDrag(index, { x1Value, y1Value, x2Value, y2Value, }); } handleEdge2Drag(moreProps) { const { index, onDrag } = this.props; const { x1Value, y1Value, } = this.props; const [x2Value, y2Value] = getNewXY(moreProps); onDrag(index, { x1Value, y1Value, x2Value, y2Value, }); } handleHover(moreProps) { if (this.state.hover !== moreProps.hovering) { this.setState({ hover: moreProps.hovering }); } } render() { const { x1Value, y1Value, x2Value, y2Value, type, stroke, strokeWidth, strokeOpacity, strokeDasharray, r, edgeStrokeWidth, edgeFill, edgeStroke, edgeInteractiveCursor, lineInteractiveCursor, hoverText, selected, onDragComplete, } = this.props; const { enable: hoverTextEnabled, selectedText: hoverTextSelected, text: hoverTextUnselected, ...restHoverTextProps } = hoverText; const { hover, anchor } = this.state; return ; } } export function getNewXY(moreProps) { const { xScale, chartConfig: { yScale }, xAccessor, plotData, mouseXY } = moreProps; const mouseY = mouseXY[1]; const x = getXValue(xScale, xAccessor, mouseXY, plotData); const [small, big] = yScale.domain().slice().sort(d3Ascending); const y = yScale.invert(mouseY); const newY = Math.min(Math.max(y, small), big); return [x, newY]; } EachRectangle.propTypes = { x1Value: PropTypes.any.isRequired, x2Value: PropTypes.any.isRequired, y1Value: PropTypes.any.isRequired, y2Value: PropTypes.any.isRequired, index: PropTypes.number, type: PropTypes.oneOf([ "XLINE", // extends from -Infinity to +Infinity "RAY", // extends to +/-Infinity in one direction "LINE", // extends between the set bounds ]).isRequired, onDrag: PropTypes.func.isRequired, onEdge1Drag: PropTypes.func.isRequired, onEdge2Drag: PropTypes.func.isRequired, onDragComplete: PropTypes.func.isRequired, onSelect: PropTypes.func.isRequired, onUnSelect: PropTypes.func.isRequired, r: PropTypes.number.isRequired, strokeOpacity: PropTypes.number.isRequired, defaultClassName: PropTypes.string, selected: PropTypes.bool, stroke: PropTypes.string.isRequired, strokeWidth: PropTypes.number.isRequired, strokeDasharray: PropTypes.oneOf(strokeDashTypes), edgeStrokeWidth: PropTypes.number.isRequired, edgeStroke: PropTypes.string.isRequired, edgeInteractiveCursor: PropTypes.string.isRequired, lineInteractiveCursor: PropTypes.string.isRequired, edgeFill: PropTypes.string.isRequired, hoverText: PropTypes.object.isRequired, }; EachRectangle.defaultProps = { onDrag: noop, onEdge1Drag: noop, onEdge2Drag: noop, onDragComplete: noop, onSelect: noop, onUnSelect: noop, selected: false, edgeStroke: "#000000", edgeFill: "#FFFFFF", edgeStrokeWidth: 2, r: 5, strokeWidth: 1, strokeOpacity: 1, strokeDasharray: "Solid", hoverText: { enable: false, } }; export default EachRectangle;
3. Создадим файл Rectangle.js в папке interactive. Это компонент rectangle верхнего уровня, который используется для рисования прямоугольника.
import React, { Component } from "react"; import PropTypes from "prop-types"; import { isDefined, isNotDefined, noop, strokeDashTypes } from "../utils"; import { getValueFromOverride, terminate, saveNodeType, isHoverForInteractiveType, } from "./utils"; import EachRectangle from "./wrapper/EachRectangle"; import MouseLocationIndicator from "./components/MouseLocationIndicator"; import HoverTextNearMouse from "./components/HoverTextNearMouse"; class Rectangle extends Component { constructor(props) { super(props); this.handleStart = this.handleStart.bind(this); this.handleEnd = this.handleEnd.bind(this); this.handleDrawLine = this.handleDrawLine.bind(this); this.handleDragLine = this.handleDragLine.bind(this); this.handleDragLineComplete = this.handleDragLineComplete.bind(this); this.terminate = terminate.bind(this); this.saveNodeType = saveNodeType.bind(this); this.getSelectionState = isHoverForInteractiveType("trends") .bind(this); this.state = { }; this.nodes = []; } handleDragLine(index, newXYValue) { this.setState({ override: { index, ...newXYValue } }); } handleDragLineComplete(moreProps) { const { override } = this.state; if (isDefined(override)) { const { trends } = this.props; const newTrends = trends .map((each, idx) => idx === override.index ? { ...each, start: [override.x1Value, override.y1Value], end: [override.x2Value, override.y2Value], selected: true, } : { ...each, selected: false, }); this.setState({ override: null, }, () => { this.props.onComplete(newTrends, moreProps); }); } } handleDrawLine(xyValue) { const { current } = this.state; if (isDefined(current) && isDefined(current.start)) { this.mouseMoved = true; this.setState({ current: { start: current.start, end: xyValue, } }); } } handleStart(xyValue, moreProps, e) { const { current } = this.state; if (isNotDefined(current) || isNotDefined(current.start)) { this.mouseMoved = false; this.setState({ current: { start: xyValue, end: null, }, }, () => { this.props.onStart(moreProps, e); }); } } handleEnd(xyValue, moreProps, e) { const { current } = this.state; const { trends, appearance, type } = this.props; if (this.mouseMoved && isDefined(current) && isDefined(current.start) ) { const newTrends = [ ...trends.map(d => ({ ...d, selected: false })), { start: current.start, end: xyValue, selected: true, appearance, type, } ]; this.setState({ current: null, trends: newTrends }, () => { this.props.onComplete(newTrends, moreProps, e); }); } } render() { const { appearance } = this.props; const { enabled, snap, shouldDisableSnap, snapTo, type } = this.props; const { currentPositionRadius, currentPositionStroke } = this.props; const { currentPositionstrokeOpacity, currentPositionStrokeWidth } = this.props; const { hoverText, trends } = this.props; const { current, override } = this.state; const tempLine = isDefined(current) && isDefined(current.end) ? : null; return {trends.map((each, idx) => { const eachAppearance = isDefined(each.appearance) ? { ...appearance, ...each.appearance } : appearance; const hoverTextWithDefault = { ...Rectangle.defaultProps.hoverText, ...hoverText }; return ; })} {tempLine} ; } } Rectangle.propTypes = { snap: PropTypes.bool.isRequired, enabled: PropTypes.bool.isRequired, snapTo: PropTypes.func, shouldDisableSnap: PropTypes.func.isRequired, onStart: PropTypes.func.isRequired, onComplete: PropTypes.func.isRequired, onSelect: PropTypes.func, currentPositionStroke: PropTypes.string, currentPositionStrokeWidth: PropTypes.number, currentPositionstrokeOpacity: PropTypes.number, currentPositionRadius: PropTypes.number, type: PropTypes.oneOf(['RECTANGLE']), hoverText: PropTypes.object.isRequired, trends: PropTypes.array.isRequired, appearance: PropTypes.shape({ isFill: true, stroke: PropTypes.string.isRequired, strokeOpacity: PropTypes.number.isRequired, strokeWidth: PropTypes.number.isRequired, strokeDasharray: PropTypes.oneOf(strokeDashTypes), edgeStrokeWidth: PropTypes.number.isRequired, edgeFill: PropTypes.string.isRequired, edgeStroke: PropTypes.string.isRequired, }).isRequired }; Rectangle.defaultProps = { type: "RECTANGLE", onStart: noop, onComplete: noop, onSelect: noop, currentPositionStroke: "#000000", currentPositionstrokeOpacity: 1, currentPositionStrokeWidth: 3, currentPositionRadius: 0, shouldDisableSnap: e => (e.button === 2 || e.shiftKey), hoverText: { ...HoverTextNearMouse.defaultProps, enable: true, bgHeight: "auto", bgWidth: "auto", text: "Click to select object", selectedText: "", }, trends: [], appearance: { stroke: "#000000", strokeOpacity: 1, strokeWidth: 1, strokeDasharray: "Solid", edgeStrokeWidth: 1, edgeFill: "#FFFFFF", edgeStroke: "#000000", r: 6, fill: '#8AAFE2', fillOpacity: 0.7, text: '', } }; export default Rectangle;
Результат рисования прямоугольника представлен на рисунке:

В результате можно расширить библиотеку, добавляя различные элементы рисования и
индикаторы. Дополнительно можно создать диалоговые окна с настройками элементов
графика. Разработчики, которым интересен проект, могут поучаствовать в дальнейшем его
развитии.
Основные проблемы, с которыми пришлось столкнуться при разработке
В библиотеке используется ряд устаревших методов жизненного цикла компонента, например,
componentWillReceiveProps. Как известно, этот метод не будет поддерживаться в следующих
версиях React (начиная с 17). Переписывание логики, заложенной в данном методе, потребует
значительных трудозатрат и дополнительного тестирования.
Заключение
Библиотека React Stockcharts позволила быстро решить задачу, показала высокую
производительность и совместимость с различными версиями браузеров. Не было замечено
каких-либо значительных визуальных задержек при рисовании различных элементов на
графике, при получении данных в онлайн режиме. Благодаря широкому функционалу,
библиотека может быть использована как готовое решение для создания торговых терминалов,
а также сайтов, отображающих информацию с финансовых рынков.
ссылка на оригинал статьи https://habr.com/ru/company/auriga/blog/505638/
Добавить комментарий