How do you deal with index fragmentation if your SQL server is working in high load environment with 24/7 workload without any maintenance window? What are the best practices for index rebuild and index reorganize? What is better? What is possible if you have only Standard Edition on some servers? But first, let’s debunk few myths.
Myth 1. We use SSD (or super duper storage), so we should not care about the fragmentation. False. Index rebuild compactifies a table, with compression it makes it sometimes several times smaller, improving the cache hits ratio and overall performance (this happens even without compression).
Myth 2. Index rebuild shorten SSD lifespan. False. One extra write cycle is nothing for the modern SSDs. If your tempdb is on SSD/NVMe, it is under much harder stress than data disks.
Myth 3. On Enterprise Edition there is a good option: ONLINE=ON, so I just create a script with all tables and go ahead. False. There are tons of potential problems created by INDEX REBUILD even with ONLINE and RESUMABLE ON — so never run index rebuilds without controlling the process.
Finally, we will tackle the REBUILD vs REORGANIZE subject and what is possible to achieve if you have only Standard Edition.
Enterprise Edition: Index Rebuild with ONLINE=ON and RESUMABLE=ON
RESUMABLE index rebuild — theory
This is from where I started: up to 100Tb per server, AlwaysOn with 2-3 readable replicas, local SSDs / NVMe with up to 200K iops, Enterprise Edition.
Reminder about RESUMABLE=ON. With RESUMABLE=ON you can always pause an operation using (killing the connection that is performing the rebuild, also puts rebuild in a paused state):
ALTER INDEX ... PAUSEYou can list indexes in resumable state using the following query:
SELECT total_execution_time, percent_complete, name,state_desc, last_pause_time,page_count FROM sys.index_resumable_operations;When rebuild is suspended, such operation even can fail over to another server! Awesome!
Also, column percent_complete shows the overall process. (for indexes with WHERE clause, however, this value is not correct)
Using ALTER INDEX … RESUME we can resume the operation (in fact, RESUME is just a syntax sugar — you can resume operation by simply executing the REBUILD command again instead of resume, just use the same options — for example, you can’t change MAXDOP on the fly). Using ALTER INDEX … ABORT you can kill the index rebuild.
In the RESUMABLE mode transactions are short, so you should not worry that LDF growth will run out of control.
First try, failed miserably
So, let’s generate a script with ALTER INDEX for all indexes in our database and run it. It would be for a few days, so let’s start it on Friday so we can check the progress on Monday.
Time to close the laptop and go home. But why are support people running between workplaces? I hear they are discussing some «slowdowns»… Wait, what are these alerts about AlwaysOn Queue Length? is it somehow related to my script? Oops, this is more serious, people are yelling about locks, apps are unresponsive, timeouts. Wow, my Rebuild lis blocking other connections! Alert dashboard is all red and yellow!
My boss is angry and telling me to stop this damn rebuild and never — your hear — never! Try it again! I want to save you from this, so let’s analyze all potential problems in advance. How can rebuild affect the production system?
-
High CPU (and IO)
-
Locks!!! (Surprise, surprise. ONLINE=ON, we believed in you, and you…)
-
LDF growth out of control
-
Problems with AlwaysOn Queue
Throttling
Let’s start with CPU and IO. We did not specify MAXDOP, and this is important. Index rebuild with a default MAXDOP can monopolize server. This is why I always specify MAXDOP, I recommend the following values:

Almost like in doom:
-
MAXDOP=1 — gently and slowly
-
MAXDOP=2 — normal mode
-
MAXDOP=4 — aggressive mode
-
(unlimited) — NIGHTMARE!
Now it is much better, for example, with MAXDOP=2 you will use 2 cores, while on a big production server you have a lot), but still there are many other problems.
For example, in MAXDOP=4 mode powerful server and populate the LDF file with 1Gb/sec and faster, which means that in 10 minutes (typical time between transaction log backups) it can fill 600Gb in LDF, which is a lot. What is worse, 1Gb/sec in LDF is 10 G-bits for AlwaysOn replication. 10 Gbit is not a big number for intra — datacenter replication, but what’s about remote datacenters used for the DR?
Hence we do need to monitor free LDF size and percentage and AlwaysOn queue. If $db is a database, you can monitor it using the following query:
USE [$db]; SELECT convert(int,sum(size/128.0)) AS CurrentSizeMB, convert(int,sum(size/128.0 - CAST(FILEPROPERTY(name, 'SpaceUsed') AS INT)/128.0)) AS FreeSpaceMB, (select sum(log_send_queue_size)+sum(redo_queue_size) from sys.dm_hadr_database_replica_states where database_id=DB_ID('$db')) as QueueLen, (select isnull(max(case when redo_queue_size>0 then datediff(ss,last_commit_time, getdate()) else 0 end),0) from sys.dm_hadr_database_replica_states where database_id=DB_ID('$db')) as ReplicationDelayInSecs FROM sys.database_files WHERE type=1Conclusion: we can’t use sqlcmd or Management Studio or SQL server job to run rebuild in unattended mode. We do need to write a script with 2 threads — one will be running the actual command, while the other will check all the parameters and throttle the main thread if something goes out of control.
What should be controlled? What thresholds should be defined?
-
CPU — it should not be too high
-
LDF minimum percentage free
-
And/or maximum size allocated
-
Maximum AlwaysOn queue length
-
Locking
In reality I had to add few other conditions:
-
Deadline, to prevent work from continuing into late night or a weekend — this is just in case, to play safe, we don’t wont DBAs on duty to be woken up in the middle of the night (however, it is not possible with huge indexes — some operations take several days)
-
Maximum size of indexes rebuilt daily (1Tb for example) — to prevent problems with QA/Dev databases, which are synched using log shipping ‘replay’
-
Custom throttling. In my case, 350 powershell lines which check job execution times of 20+ most important jobs and 15+ other critical parameters — to throttle the process or to even to panic and to abort an operation completely.
I wrote flexible parametrized script on PowerShell and i wanted to share it with you, it is non profit and open source: https://github.com/tzimie/GentleRebuild (project site https://www.actionatdistance.com/gentlerebuild )
This is how it looks like:

Wait, why am I using kill command instead of PAUSE? There are important reasons for that.
Locking
Despite the fact that we are using REBUILD with ONLINE=ON, locking is possible on both sides:
useful workload —> INDEX REBUILD —> useful workload
We don’t care about the right part. Our rebuild can wait. The only problem could be alert systems yelling about locks. Scripts runs a rebuild in a connection marked with program_name=Rebuild. So you can add (WHERE … AND program_name not like ‘Rebuild%’) to your alert system to ignore this process.
The left part is more important. If we lock any process, we need to yield, execute PAUSE, and then, after a while, continue using RESUME.
However, the biggest problem is when there are both sides of the lock at the same time. So when the rebuild process is locked (right side), at the same time there is a process waiting for rebuild. To yield we run the PAUSE command and … nothing happens, because the rebuild process is locked, and PAUSE tries to finish the last chunk before going into paused mode.
This is where kill command helps us: we lose the very last work chunk (few seconds), but we yield quickly. After kill rebuild falls into PAUSED status and it can be resumed later.

You can see how the script yields on the screenshot above. Why does ONLINE=ON cause locks? Most of the locks come from ‘TASK MANAGER’ internal connections, doing automatic statistics updates. The locks that affect other processes are, based on my experience, mostly schema locks.
In the custom module, you can define the reaction of the script to other processes being locked. For example, some background processes can wait longer, while for the interactive processes scripts should yield asap. This module is called VictimClassifier, and it is very useful for Standard Edition, where locking is inevitable.
As a reminder, you should not worry about fragmentation levels in very small tables (page_count<1000), they still show high fragmentation levels even after rebuild. Often it makes sense to rebuild tables with index fragmentation > 40%, however, indexes sometimes become significantly smaller on disk even for very low fragmentations levels.
If you rebuild with COMPRESSION=PAGE/ROW, you should not take fragmentation levels into account because you need to change the compression anyway. Important warning: if there is a manipulation with partitions using ALTER TABLE… SWITCH PARTITION, tables on both ‘sides’ should have the same compression! So be careful when you automatically apply compression to big tables leaving small tables (which participate in SWITCH PARTITION magic) unaffected.
Don’t take a paused resumable state for granted. It is still affecting your system, even it is paused. This happens because SQL server has to track all changes to apply them to the ‘future’ image of the index as well, so it modifies execution plans for queries, which do insert/update/delete into/from that index. These operations become slower. In case of merge statement, it could be significantly slower. This is why the ‘panic’ response from custom throttling module not only pauses the rebuild, but also aborts it.
And yes, I learned all the above the hard way. In general, my experience was like this:

Hopefully, this script will help you avoid all these troubles.
Finally, some indexes don’t support RESUMABLE=ON and even ONLINE=ON. In such case check what is possible for the Standard Edition.
What’s about Standard Edition?
In the Standard Edition you can’t use RESUMABLE=ON and even ONLINE=ON. What is left? INDEX REORGANIZE or doing INDEX REBUILD as quickly as possible in a controlled manner using the script.

The picture above is not random.
So, all operations in SE are not resumable. Script GentleRebuild still tracks everything, including locking. But as operations are not interruptable, throttling occurs only between the operations (new index rebuild is not started until throttling indicates that everything is OK. There are 2 exceptions however — locking and custom throttling conditions, which can control ‘interruptive power’ — soft throttling (between the operations), hard (interrupting current operation), and panic — aborts everything and exits.
The most important is locking, and kill rolls the index rebuild back, which might take quite a while (hours!) still holding the lock. The rollback could be even longer than the operation itself!
This is how I came to the analogy with a man on bridge. You walk by a bridge and a train approaching. There is no place for both of you, where to run? Backward or forward toward the train — but it would make sense if you had almost crossed the bridge. But for the non resumable index rebuild we even don’t have progress indicator in percent!
Getting the right estimation for the percent of work done
After several experiments, I found that in most cases the dependency between page_count of the original index and logical_reads in sys.dm_exec_requests is linear:

But there are many factors as well. After attempts to minimize an error using minimal square methods, I ended up with the following formulae for the progress:
-
P — page_count of the original index
-
L — logical_reads in sys.dm_exec_requests
-
D — density from sys.dm_db_index_physical_stats (mode ‘DETAILED’)
-
F — fragment_count from sys.dm_db_index_physical_stats
-
W — physical writes
For clustered indexes (multiply by 100 for percentage):
For non-clustered:
For COMPRESSION=PAGE use different formulae, for clustered:
For non-clustered:
COMPRESSION=ROW was not estimated because results vary a lot. In any case, script does the calculation for you, so you still get the ETA and pct in a log (but it warns that it is ‘rough estimation’). In most cases, it is 10% accurate.
Where to run? Kill/rollback or to wait until the end?
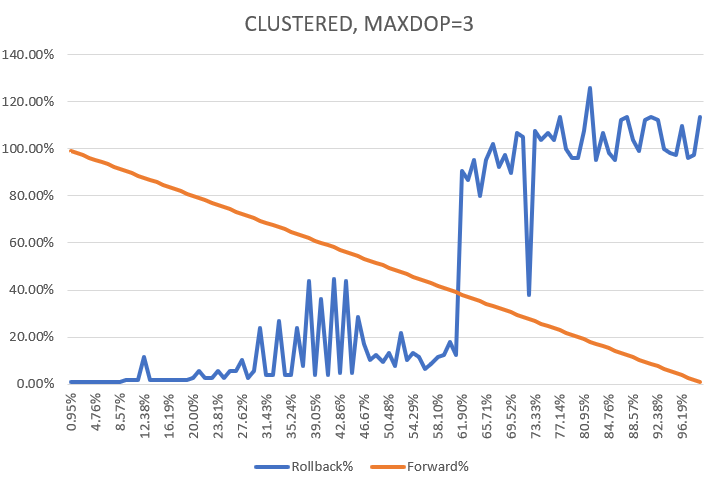
created a program to test multiple scenarios. Let’s start with MAXDOP=1:

The orange line is percentage time until the end of operation, which steadily decreases from 100 to 0. The blue line is a time to finish the rollback if interrupted at X% before the end (as I was doing the experimentation many times restoring the same database from backup, I had luxury of knowing exactly how long does it take for any index rebuild)
Based on a chart, until 75% it is faster to do the rollback, after 75% it is faster to wait until the rebuild finishes.
Now let’s try to play with MAXDOP. Note that for some indexes MAXDOP is ignored and only one thread is used.

For MAXDOP=2 «point of no return» is around 63%. For higher MAXDOP chart becomes crazy:

Note that for Y we have values higher than 100% — so rollback takes more time than an operation itself. it makes sense as rollback works in a single thread. Higher MAXDOP — more crazyness:

Point of no return is even at 42%.


For NONCLUSTERED charts are slightly different as has slightly different «points of no return».
So for MAXDOP>2 server behaves weirdly, but work is finished faster:

Y is time (seconds). As you see, the higher MAXDOP the faster the work is done (blue line), while orange line shows the time of the worst rollback scenario.
Conclusion
Use MAXDOP=1 or 2 if you plan on using kill because table is heavily accessed. otherwise set maximum MAXDOP to finish as fast as possible ignoring locks (use script configuration parameter killnonresumable=0 — then locks are displayed in a log, but do not trigger kill/rollback)
Otherwise (killnonresumable=1), script GentleRebuild kills the operation only if it didn’t reach the «point of no return», which is defined by heuristics ($maxdop is a number of records in sysprocesses — it is MAXDOP+1, or 1, so it actual MAXDOP, not the MAXDOP you requested — it might be different):
# returns point of no return value # note that for MAXDOP=n there are typically n+1 threads, so $maxdop=2 should never occur function PNRheuristic([int]$maxdop, [string]$itype) { if ($maxdop -gt 9) { return 40. } if ($itype -eq "CLUSTERED") { $heur = 75., 63., 63., 55., 45., 43., 42., 40., 37. } else { $heur = 86., 74., 74., 70., 64., 55., 50., 45., 40. } return $heur[$maxdop-1] }Victim Classifier
But should we panic for any locked processes? There are processes that definitely can wait -update statistics, some background time-insensitive ETL processes. But there are interactive processes that are critical.
custom.ps1 module has a stub of a function which you can adjust for you needs. Originally it looks like as:
function VictimClassifier([string] $conn, [int] $spid) { # returns: # cmd - details of the blocked command # cat - category this connection falls into # waittime - time this connection already waited, sec # maxwaitsec - maximum time for this connection allowed to wait if (Test-Path -Path "panic.txt" -PathType Leaf) { return 3 } # $waitdescr, $waitcategory, $waited, $waitlimit $q = @" declare @cmd nvarchar(max), @job sysname, @chain int select @job=J.name from msdb.dbo.sysjobs J inner join ( select convert(uniqueidentifier, SUBSTRING(p, 07, 2) + SUBSTRING(p, 05, 2) + SUBSTRING(p, 03, 2) + SUBSTRING(p, 01, 2) + '-' + SUBSTRING(p, 11, 2) + SUBSTRING(p, 09, 2) + '-' + SUBSTRING(p, 15, 2) + SUBSTRING(p, 13, 2) + '-' + SUBSTRING(p, 17, 4) + '-' + SUBSTRING(p, 21,12)) as j from ( select substring(program_name,charindex(' 0x',program_name)+3,100) as p from sysprocesses where program_name like 'SQLAgent - TSQL JobStep%' and spid=$spid) Q) A on A.j=J.job_id select @cmd=isnull(Event_Info,'') from sys.dm_exec_input_buffer($spid, NULL) select @chain=count(*) from sysprocesses where blocked=$spid and blocked<>spid select distinct @cmd as cmd,isnull(@job,'') as job, @chain as chain, waittime/1000 as waittime,open_tran, rtrim(program_name) as program_name, rtrim(isnull(cmd,'')) as cmdtype from sysprocesses P where P.spid=$spid "@ $vinfo = MSSQLscalar $conn $q $prg = $vinfo.program_name $cmd = $vinfo.cmd # top level command from INPUTBUFFER $cmdtype = $vinfo.cmdtype # from sysprocesses $job = $vinfo.job # job name if it is a job, otherwise "" $chain = $vinfo.chain # >0 if a process, locked by Rebuild, also locks other processes (chain locks) $waittime = $vinfo.waittime # already waited $trn = $vinfo.open_tran # has transaction open # build category based on info above $cat = "INTERACTIVE" if ($cmd -like '*UPDATE*STATISTICS*') { $cat = "STATS" } elseif ($job -like "*ImportantJob*") { $cat = "CRITJOB" } elseif ($cmdtype -like "*TASK MANAGER*") { $cat = "TASK" } # likely change tracking elseif ($job -gt "") { $cat = "JOB" $cmd = "Job $job" } elseif ($prg -like "*Management Studio*") { $cat = "STUDIO" } elseif ($prg -like "SQLCMD*") { $cat = "SQLCMD" } if ($chain -gt 0) { $cat = "L-" + $cat } # prefix L- is added when there are chain locks, it is critical elseif ($trn -gt 0) { $cat = "T-" + $cat } # prefix T- means that locked process is in transaction $cmd = $prg + " " + $cmd # allowed wait time before it thrrottles or kills rebuild $maxwaitsecs = @{ "INTERACTIVE" = 30 "STATS" = 36000 "JOB" = 600 "CRITJOB" = 60 "STUDIO" = 3600 "SQLCMD" = 600 "T-INTERACTIVE" = 30 "T-STATS" = 600 "T-JOB" = 600 "T-CRITJOB" = 30 "T-STUDIO" = 1800 "T-SQLCMD" = 600 "L-INTERACTIVE" = 20 "L-STATS" = 20 "L-JOB" = 20 "L-CRITJOB" = 20 "L-STUDIO" = 20 "L-SQLCMD" = 20 "TASK" = 900 "L-TASK" = 60 "T-TASK" = 600 } return $cmd, $cat, $waittime, $maxwaitsecs[$cat] } As you can see, functions perform a triage based on data in DBCC INPUTBUFFER, job name and sysprocesses. If locked process is in a transaction, ‘T-‘ is prepended to category name, so you can assign different timeout. Finally, if locked process also locks other processes (which is much worse) — category name is prepended with ‘L-‘. Typically the timeout for ‘L-‘ is less than for ‘T-‘ which is less than for the default category.
Based on category function calculates the value — the number of seconds a process in that category can wait.
The interruption logic is the following:
-
If we are behind the «point of no return» — bad, but we will wait until the operation finishes on it’s own
-
Otherwise, if blocked process has waited longer than allowed by it’s category — we do kill/rollback
-
Otherwise, add time the process already waited to the estimated time until the operation will finish based by the estimated percent of the work done (projected time). If time already waited plus projected time is more than time allowed to wait — we do kill to prevent the problem much earlier when it becomes visible.
-
For the interruptable operations (RESUMABLE=ON, REORGANIZE) projected time is not calculated, but the operation yields when the wait time becomes longer than time allowed to wait. So victim classifier for such operations allows to avoid immediate yielding based on locks
-
If there are multiple locked processes, script takes the most critical, with the minimal time allowed to wait.
This is how it looks on a real system:

Even through all that logic helps a lot, it doesn’t guarantee you from problems. You can be in red zone because the estimated percentage is far from reality, of if rebuild is behind of «point of no return» and there is a lock of a critical process.
Script parameter offlineretries=n allows GentleRebuild to retry the rebuild multiple times after kill/rollback, and when n attempts are exhausted it skips the index and goes to the next.
So in general if there is a table under constant heavy stress then in Standard Edition there is little you can do except doing INDEX REOGRANIZE. There are few benefits on offline index rebuild, however. You can use SORT_IN_TEMPDB (not compatible with RESUMABLE=ON). Use parameter sortintempdb=n — it enables SORT_IN_TEMPDB if an index is less than n Mb. Finally, forceoffline=1 «transforms» Enterprise Edition into Standard for a script GentleRebuild.
Index REOGRANIZE as last resort
because it works even on a Standard Edition, and index reorganize doesn’t hold any long locks, doesn’t create stress on a server because it works in a single thread, so it is safe, right?

Comparing the quality
On a copy of one of our PROD databases I conducted an experiment, rebuilding indexes using options by default, using COMPRESSION=PAGE and ROW and using INDEX REORGANIZE
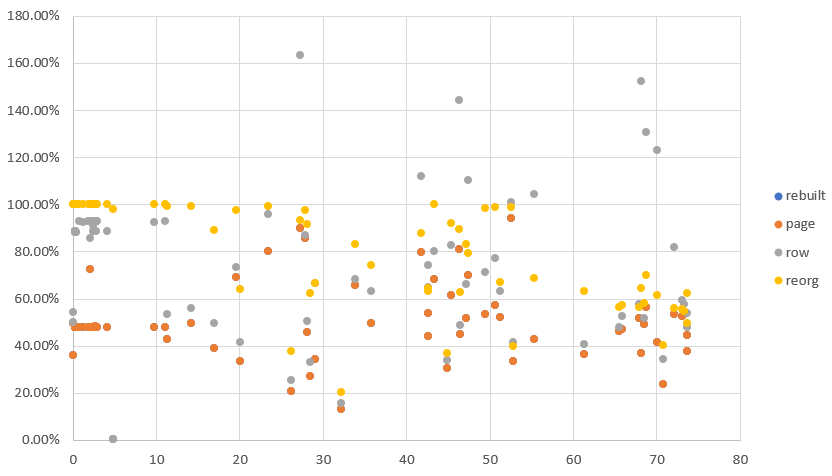
Let’s start with the non clustered indexes:

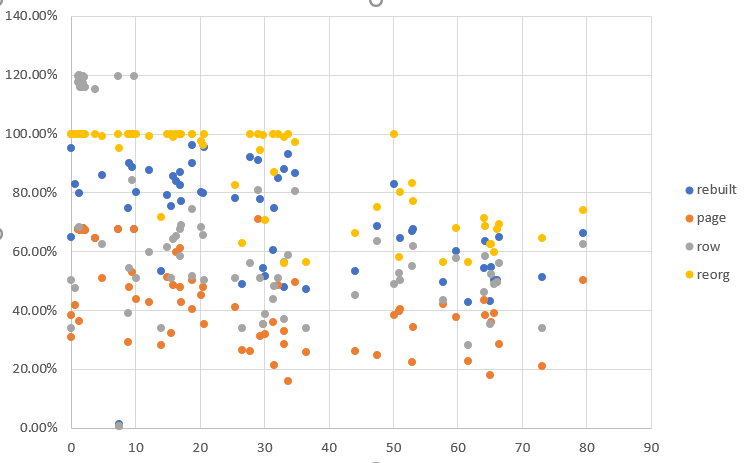
X is the original fragmentation level in percent. Y is the difference (after/before) of an index size after the operation. So 25% would mean that the index became 4 times smaller, 100% means no change.
Where are the blue dots, series ‘rebuilt’? They are covered with the series ‘page’ as they are identical — I believe because we had ‘good’ indexes on INT and GUID, where almost nothing can be packed. COMPRSSION=ROW sometimes made things worse, so index became bigger after the rebuild. So you should decide case by case. I recommend using no compression or PAGE.
yellow dots (reorg) are higher (worse) than rebuild, so the quality of index reorganize is so-so. You can also see many points around Y=100% — there was nothing reorg could improve.
For the clustered indexes it is different:

Compression=page is the best, reorganize works but is not as good as index rebuild.
Duration
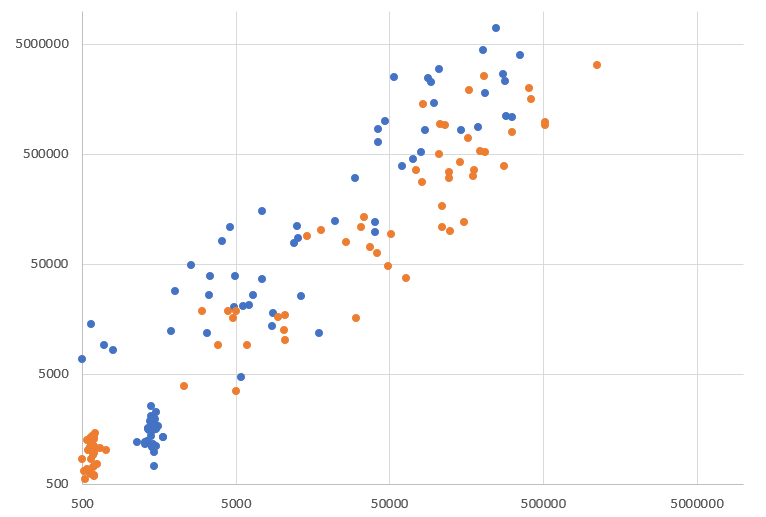
Even for MAXDOP=1, rebuild appears to be many times faster than reorganize.

Red dots — rebuild, blue — reorganize. Reorganize takes longer for non clustered indexes by 3-5-7 times, for the clustered ones the difference was up to 30 times. Sometimes IDNEX REORGANZIE never ends, i will explain later why.
Of course, like for index rebuild, it would be nice to have estimations of the progress. Here is the formula:
-
W — Writes — from sys.dm_exec_requests (connection where reorganize works)
-
L — logical_reads from sys.dm_exec_requests
-
P — page_count — index size in pages from sys.dm_db_index_physical_stats
-
F — fragment_count — number of fragments from sys.dm_db_index_physical_stats
-
D — density — from sys.dm_db_index_physical_stats — ‘DETAILED’ mode
For clustered indexes percent of the work done (multiple by 100)
For non clustered indexes:
Estimation is usually 7-10% accurate. The script will show the progress and ETA.
Problems with Index Reorganize
Yes, Index reorganize doesn’t hold long locks on data. But it holds a lock on schema. Which locks automatic statistics updates. And other processes can be locked by these updates. Hence, we still need to run REORGANIZE in a controlled manner, using a GentleRebuild.
After REORGANZIE is interrupted and resumed, script GentleRebuild remembers the last values of L and W to correctly calculate the estimation. However, in many cases W doesn’t grow for a while — SQL server scans pages where everything is already reorganized last time, before the script was interrupted. So it has to ‘rewind’ to the last unaffected place, and it takes time, on big indexes — even hours. So if an index is big enough and interruptions are frequent enough, it might happen that most and finally all time SQL server would be doing the ‘rewinding’.

There is yet another problem. A few times REORANIZE started to slow down important ETL processes (without causing any locks, however). At the same time estimated percent of work done, which is typically
+/- 15% accurate grew continuously to 150%, 200% and even more.
I believe that in some cases an area, where INDEX REOGRANIZE is doing its page movement collides with an area where processes are writing data, and in our case (24/7), they are doing it non-stop. So they enter almost infinite loops of inserted new data -> fragmentation -> reorganzie — next insert just arrived etc.
For that reason script finishes INDEX REORGANZIE as soon as estimated percentage reaches 120% and recalculates the fragmentation statistics. The same can be achieved using in interactive script menu (Ctrl/C), command R.
Finally
Remember that index fragmentation deteriorates, so you should search fragmentated indexes from time to time to redo the rebuild/reorg:

Actual git repository: https://github.com/tzimie/GentleRebuild
Project site: https://www.actionatdistance.com/gentlerebuild
ссылка на оригинал статьи https://habr.com/ru/articles/761518/
Добавить комментарий